While stuck at home, now is a good time to start a fun side project. I always wanted to try out Phaser.io, a HTML5 game development framework. Only, I didn’t have a good starting point for writing my first ‘game’. Then an opportunity came along…
The Opportunity 🤔
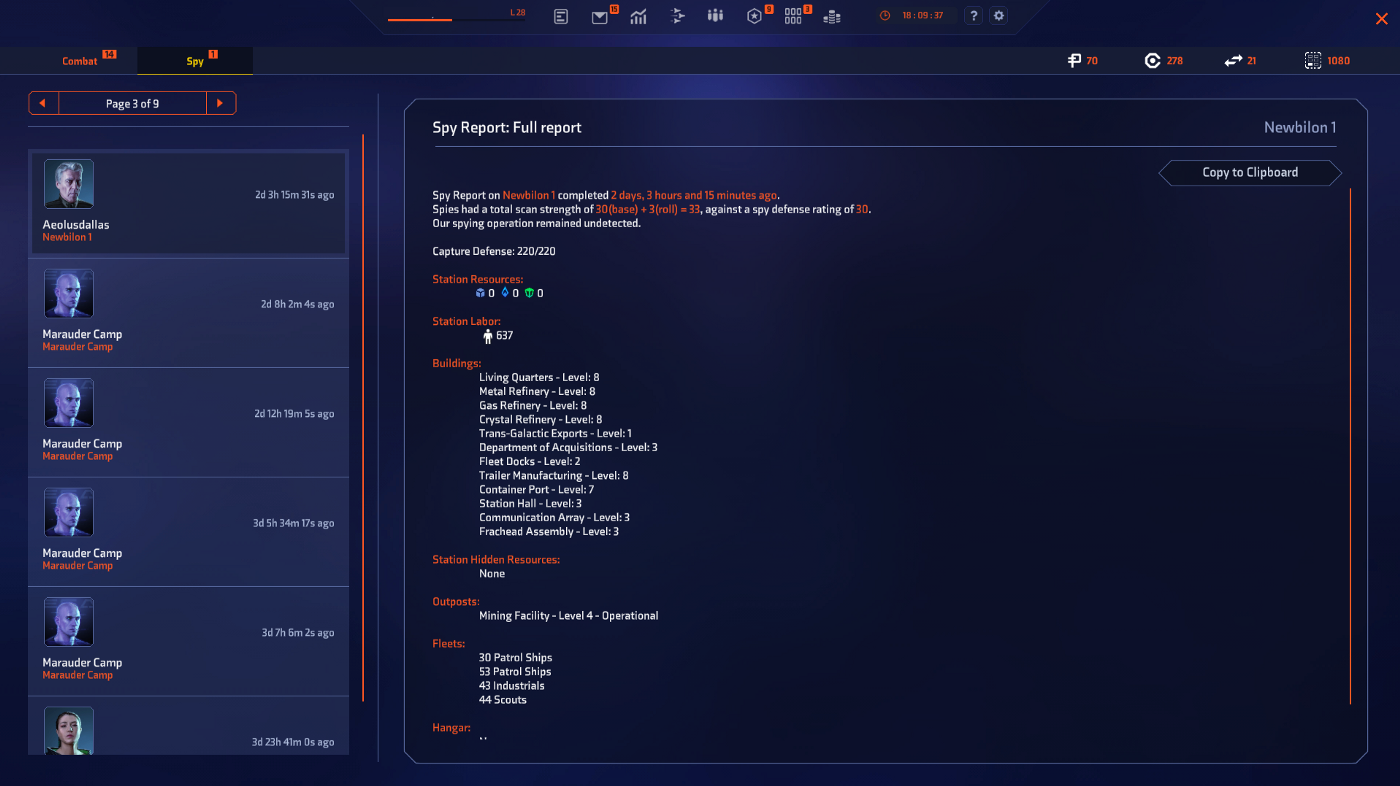
While I was playing Starborne, an MMO Space Strategy game, one of the things you can do here is spy on other players space-stations, which generates a simple report with all characteristics of the station. If you look at the screenshot, you’ll see that you can click “Copy to clipboard”. What you don’t see here, is when you copy to clipboard, the map coordinates of the station are included.
Not soon after the starting round, a team member created a simple Google Forms where all members can copy-paste their reports into, so the results could be quickly shared via a GoogleSheet acting as the backend of the GoogleForm. With this “central intelligence” in place, everyone in the team has access to all reports — but in textual format only…
The Challenge ☝️
By now, you can guess where I’m going with this…
Wouldn’t it be cool to show these ‘spy reports’ on a map?
Yes, that would be nice. But plotting X-Y coordinates isn’t really a challenge (we’ve got enough Javascript charting libraries as is).
However, the map of Starborne can’t be plotted on a rectangular map, because the map is hexagonal. The coordinates in the report are also hexagonal coordinates — instead of regular X-Y coordinates in Cartesian Coordinate system. Furthermore, I needed to get the data from a (ever changing) GoogleSheets file in a structured manner imported, parsed, and displayed on this map.
Now, that’s sounds like a fun challenge!
Start diggin’ ⛏️
The Map
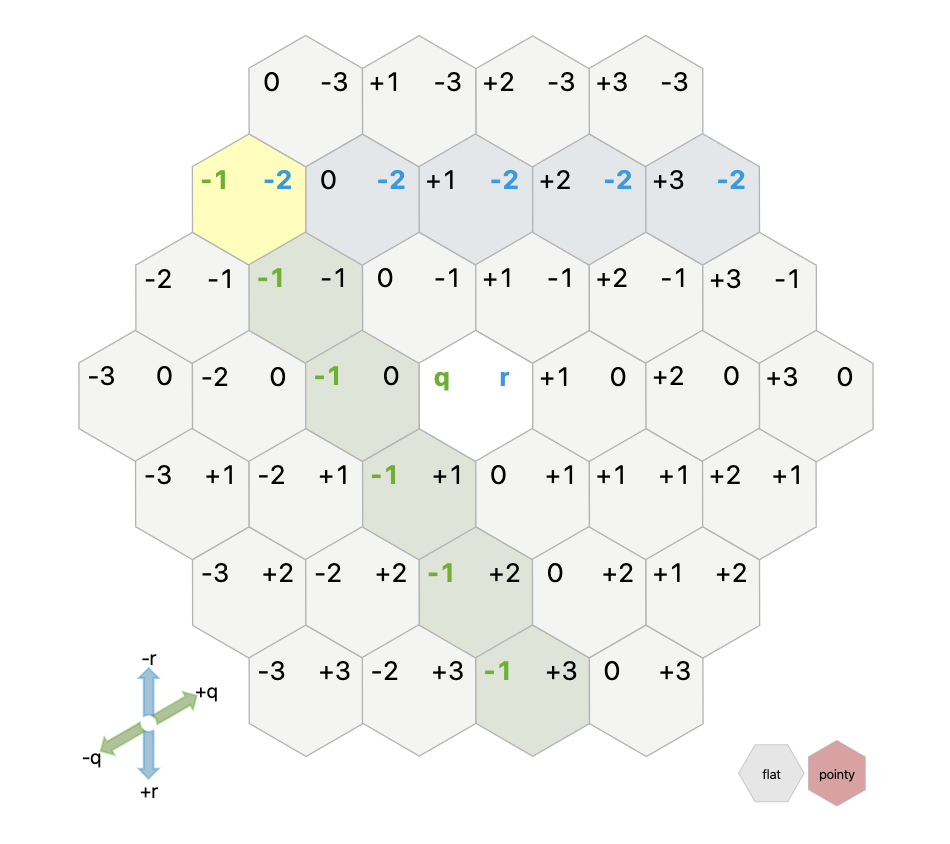
To get started with hexagonal coordinate systems, take a look at this excellent interactive documentation from RedBlobGames. It also features all the different coordinates systems you can use with these kind of maps. To know which one to use, I had to check which of these systems Starborne uses, so I’m able to recreate their map on my own. Turns out they use the ‘axial coordinate system’, with the center as (0,0).
From there, the code can be created for the Hexagon model using TypeScript:
export class Hexagon {

  public readonly centerPixel: Pixel
  public readonly height: number
  public readonly width: number

  constructor(public readonly q: number,
              public readonly r: number,
              public readonly size: number) {
    this.centerPixel = this.pointyHexToPixel()
    this.height = 2 * size
    this.width = size * Math.sqrt(3)
  }

  /**
   * https://www.redblobgames.com/grids/hexagons/#hex-to-pixel
   */
  private pointyHexToPixel(): Pixel {
    const x = this.size * (Math.sqrt(3) * this.q + Math.sqrt(3) / 2 * this.r)
    const y = this.size * (3. / 2 * this.r)
    return new Pixel(x, y)
  }
}
In the code above, you can see there is a translation between the Coordinate (q,r) and the (center) Pixel (x,y) , which will come in handy once we start rendering the Hexagons with Phaser. size is the ‘outer radius’ of a hexagon.
Likewise, here is the TypeScript code for the grid itself, which uses these Hexagon with a custom TupleMap<T> . This TupleMap<T> is a simple wrapper around the native javascript Map<Key, Value> so it’s possible to use coordinate numbers as keys for the Map feature.
export class HexagonGrid {

  public readonly hexes: TupleMap<Hexagon> = new TupleMap<Hexagon>()
  public readonly depth: number

  constructor(depth: number, public readonly size: number) {
    for (let q = -depth; q <= depth; q++) {
      for (let r = -depth; r <= depth; r++) {
        if (Math.abs(q + r) <= depth) {
          this.hexes.set([q, r], new Hexagon(q, r, size))
        }
      }
    }
  }
After creating the models, we need to render them through Phaser. Starting out by checking some tutorials and examples of Phaser, I quickly stumbled upon this post about hexagonal grids in Phaser. This was my starting point, but I needed to change quite a bit because this map uses another hexagonal coordinate system. The code from that blogpost uses .png images for displaying hexagons, which are used in turn for Phaser.GameObject.Image objects in Phaser for rendering. Although this works when you don’t have a lot of hexagons, the map of Starborne is pretty big and I soon ran into performance issues.
To give you an idea about the map sizes: In the screenshot above, the map has a “depth” of 3, meaning, when you count the hexes from the center to an outer hexagon, you count 3 (center hex counts as 0). The formula to count the number of hexes, based on ‘depth’ is (2×d+1)²−d×(d+1). So that means:
- Depth of 0 → 1 hex
- Depth of 1 → 7 hexes
- Depth of 2 → 19 hexes
- Depth of 3 → 37 hexes
If you want to render each hexagon as an image, you need to render 37 images with a depth of 3. That’s not too bad, the browser can handle that. Now, the map size of Starborne has a depth of 500, so that means 751501 hexagons. So no, rendering 750k images did not play well…
Also when trying to render the hexagons as svg lines instead of images (using Phaser.GameObject.Graphics), the performance improved a bit, but not enough to be able to render all hexagons for this map size.
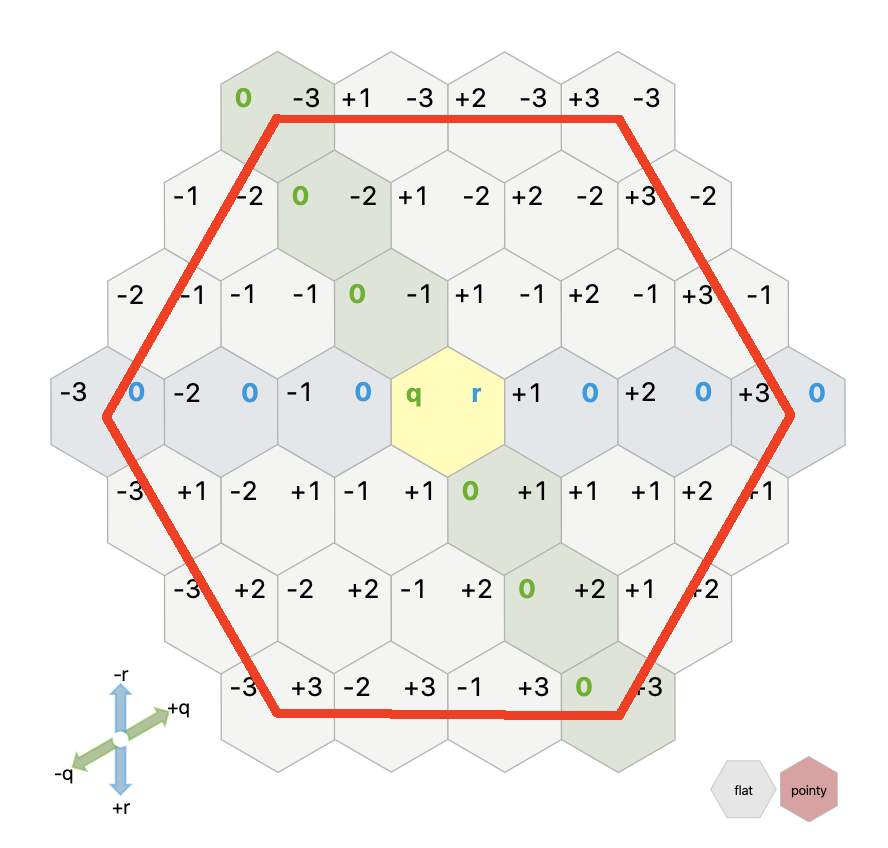
I settled on not displaying all the hexagons themselves, and only showing the outline of the map (which is just 1 hexagon). I do however calculate all the coordinates and pixels related to all inner hexagons, so I’m able to draw on any on these points when I want to. An example of an outer edge for a depth of 3 is drawn on the screenshot.
In Phaser, you can use the Phaser.GameObjects.Graphics class to draw lines with WebGL (or Canvas). The code for the ‘outline hexagon’ looks like this:
export class HexagonGridOutlineGameObject extends Phaser.GameObjects.Graphics {
  constructor(scene: Scene, grid: HexagonGrid) {
    super(scene, {})

    const pixels: Pixel[] = grid.outerHexes().map(h => h.centerPixel)
    const startPixel = pixels[0]

    // set a fill and line style
    this.lineStyle(2, 0xffd900, 1)

    this.beginPath()
    this.moveTo(startPixel.x, startPixel.y)
    for (let i = 1; i <= 5; i++) {
      this.lineTo(pixels[i].x, pixels[i].y)
    }
    this.lineTo(startPixel.x, startPixel.y)
    this.stroke()
    this.closePath()
  }
}
With the map problem solved, let’s move on to the data that should be displayed on this map.
The Spy Reports
All data comes from a GoogleForms which pumps it into a GoogleSheet. A very simple and effective way to ‘expose’ data from a GoogleSheet to the web, is via the ‘Publish to Web’ function as explained in this blogpost, which will turn your sheet into a JSON Api endpoint in a couple of clicks. It’s not the most prettiest JSON you’ll see, but I’ll take it.
Phaser has a build in http-client which let’s you fetch data in 1 line of code and caches it for the rest of the ‘game’:
// Load sample assets - preferably during `preload`
game.load.json('spyReportData', 'https://example.com/data.json')

// Use the data somewhere else
const jsonData = game.cache.json.get('spyReportData')
Next, it comes down to parsing the JSON from this endpoint into separate ‘spy report’ objects, which can then be shown on the map.
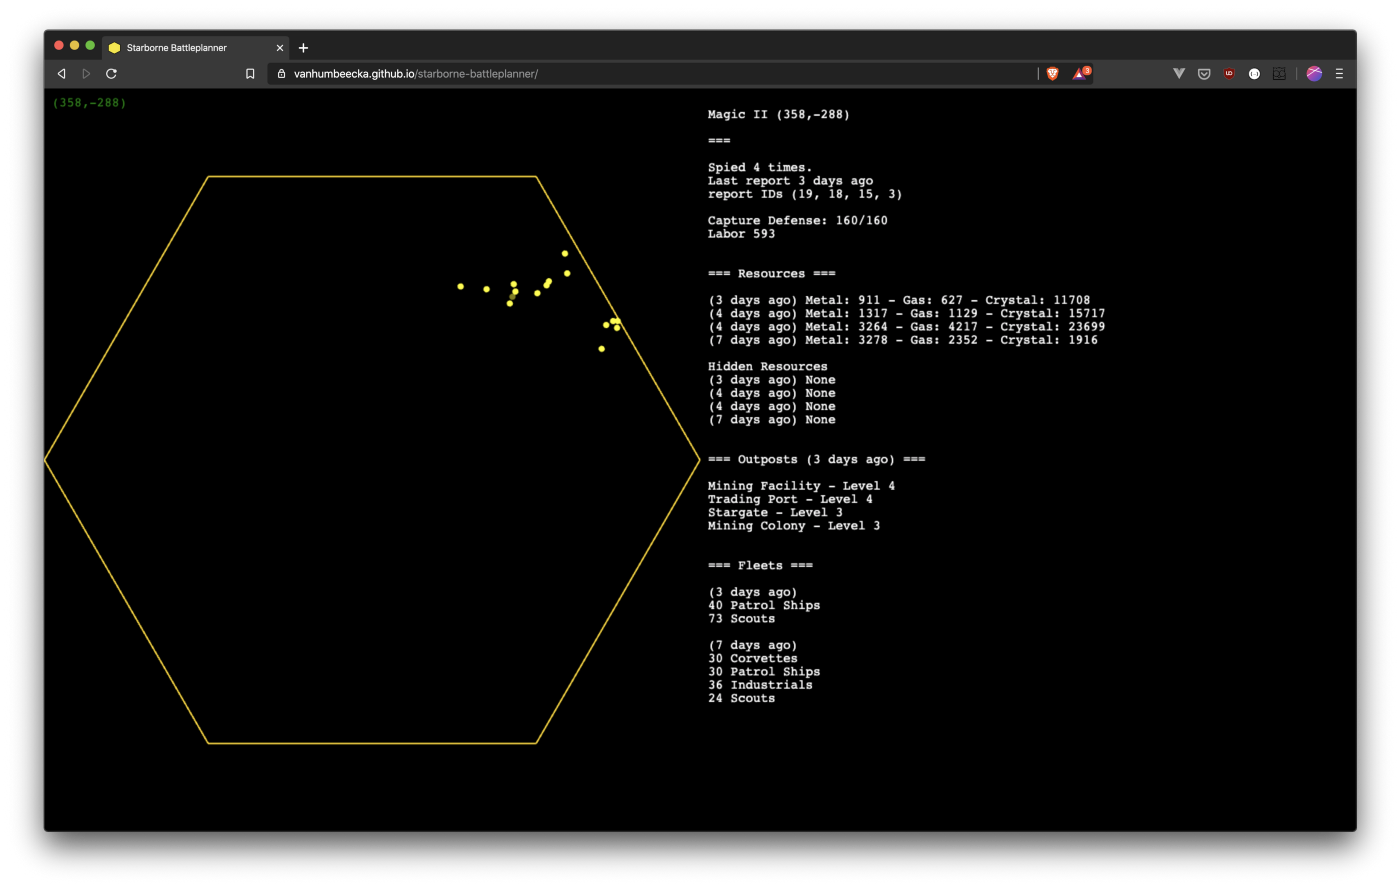
I ended up with combining all spy reports from the same location into 1 object shown on the map. It’s depicted as little circles and when hovering, shows you the data associated with the location. Here is a screenshot of the result.
Was Phaser the right choice? 🧐
Phaser is meant as a framework for stand-alone HTML games. You can pump data in to it on startup (like I did), but it’s not meant to interact with the rest of the DOM in your Html page (although you probably could). That’s also the reason I display the text from the reports in Phaser as well, instead of outside the ‘game-scene’.
Nevertheless, Phaser V3 has a nice API which gives you a lot of flexible tools to do all kinds of stuff. I was able to do everything I wanted to do in this side project with Phaser, and enjoyed using it.
An alternative rendering framework like D3 would also have been an option, especially because it would allow you to better integrate with the rest of the elements on your page. But I’ve always found the interface of D3 a bit too abstract to my liking.
Can I see the code? 💻
Yes! I’ve open-sourced the repository on Github. The repository can be found here. The end result can be found here.
Have fun!
Last modified on 2020-04-15